Safe as Houses
Residential Property in New Zealand is said to have risen by 7%p.a these last 20 years, but we’re starting to hear stories of the tide turning. How far, how fast or, even if at all – who is to say?
History shows that occasionally, dramatic residential property crashes occur, but not so much in Australia or New Zealand (which isn’t to say, it can’t happen). So, what might be a catalyst for such a thing?
In March, the ANZ commented that inflation is expected to peak at 7.4% in Q2 2022 - higher than earlier forecast. Already, it’s the highest inflation rate in forty years. One might ponder, if interest rates are intrinsically tied to inflation rates, then just what were mortgage rates back in 1982?
We feel we have a way to go before we need to worry about 1980’s-type interest rates but, it does feel as though the Reserve Bank (RBNZ) will take a more aggressive approach to pushing rates higher. ANZ suggest the RBNZ may hike the OCR by 0.50% in April and then again in May. It clearly suggests a tougher time ahead for those who have taken on a large mortgage in recent times.
If we look to the long term, good investments usually work out. It’s the same message when reflecting on share market values (they tend to be more volatile and usually return more as a result).
Below is a table, which reflects the long-term average returns from various asset classes in the USA. The surprise for me was the housing market. We’d have thought their property market would’ve risen more. Based on the stats below, USA house prices rose these last 20 years by 4.17%p.a.
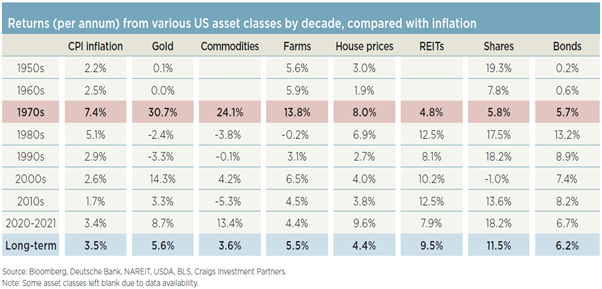
In NZ, house prices have apparently been rising on average 7%p.a these last 20 years. But that number overstates many things. Expenses are ignored. Any capital improvements are part of the implied gain, but surely that is a capital injection? So, what then is the actual net position? I’d be thinking 5% is likely more accurate. Let’s try to find the truth…
Apples to Big Apples
USA House Prices (implied gain 4.17%p.a) and NZ House Prices (implied gain 7.00%p.a)
Hypothetically, let’s say a good house cost $250,000 in January 2002. On that basis, today (2022) the USA house is worth $566,250 (4.17% gain p.a), while the NZ house is $967,500 (7%p.a). As mentioned, this average “return” fails to deduct costs, nor recognise any additional capital added (let’s leave rental income and tenant risk out of the equation for the moment).
We need to add back some costs. What is the average cost to hold a residential property over 20 years? To begin to answer this, we need to make some assumptions. Let’s say:
- 2002 value $250,000
- 2022 value $967,500
- Average annual holding cost $5,000p.a (rates, insurance, repairs & maintenance)
Just recognising these costs would reduce the implied return in NZ from 7%p.a. to 5.9%p.a; but as most of us borrow to buy our home, interest rates also take a toll. So, costs aren’t just council rates, insurances, repairs or maintenance. There’s usually an interest component to consider, this is called leverage.
Leverage
- 2002 Value $ 250,000
- Deposit $ 50,000 (our money)
- Mortgage $ 200,000 (the banks money, over 20 years)
To repay $200,000 over 20 years (assuming average mortgage rates between 2002 & 2022 of 6.15%p.a), means that our total principal and interest repayments were $348,000. Plus the matter of the $5,000p.a average holding cost, which over 20 years amounts to around $100,000.
So, our investment was $448,000, its value now is $967,500. Still sounds like a great deal to me!!
The initial investment was $50,000. $448,000 is added over 20 years (let’s call it $25,000 a year). Today, we appear to have made $467,500 profit (if values hold) and, we had somewhere to live. We saved paying rent and we now have an asset to show for it. There’s also an inflation consideration in all this. The purchasing power of money changes through time, distorting perceived “value” but ultimately, we are talking about the same house.
The return on this property can be calculated as a $50,000 deposit and $25,000 annual outgoings for 20 years, resulting in $967,500. In the USA, it resulted in $566,250. This validates what we do know; that housing in NZ is now very expensive.
It is also more realistic to assume a net return calculation closer to 5%p.a (rather than the gross 7%p.a REINZ would tell us). Of course, the leverage amplified the return on our $50,000 deposit (the equity) to 16%p.a (we take out the interest costs, because we could otherwise have just paid rent). 16%p.a is excellent, but it wasn’t the house that produced this, it was the leverage (the borrowing). Gearing amplifies returns on the way up and it will amplify any loss on the way down. And that’s another story.
In summary
Most housing in NZ hasn’t risen 7%p.a these last 20 years, but it has been an exceptional period of very high returns and there is now a risk that we may be heading into a period of consolidation. It stands to reason, if housing has risen 33% already, the years remaining in this decade are unlikely to deliver anything near that. We’d expect a much, much smaller number.
The value of housing in NZ is extremely high by comparison to almost any measure. Today, there are more headwinds than ever, not least of which are escalating material prices, taxes and rising interest rates. Having to pay more interest, means there is less household income to spend on everything else.
I don’t envy the Reserve Bank, nor our elected officials. They need to tread carefully in this, as many of us have a very “large” vested interest and hence why moderation may take some time.
Tony Munro | CFPCM, Post Grad Dip. Bus.Studies (PFP)
The views and opinions expressed in this article are intended to be of a general nature and do not constitute personalised advice for an individual client.